PAVEMENT INSPECTION

Our GPR & IRT highway inspection provides information on pavement structure and layer thickness, and our surveys can detect various forms of pavement deterioration, voids and regions of excessive subsurface moisture. We utilize state-or-the-art IRIS non-contacting GPR and IRT equipment operating at highway speed and requiring no traffic control. GPR can cover several hundred lane miles per day, making this technology ideal for network level and project level inspection of highway pavement. Penetradar’s pavement surveys produce graphical and numerical results that are easily understood and readily usable by pavement and maintenance engineers.
Non-Destructive Testing Methods
The three non-destructive testing methods below can be used individually or together in pavement inspections. Using multiple methods together can increase the reliability of the results by using different technologies. More information on how each of these technologies are used in the inspection of pavements can be found by clicking on their respective buttons.
Ground Penetrating Radar (GPR)
High Speed Pavement Surveys
Ground Penetrating Radar has found application in evaluation of pavements. GPR has been effective in measuring layer thickness, detecting voids, identifying areas of high subsurface moisture and detecting deteriorated concrete. For pavement inspection projects, specialized GPR equipment is employed, such as the Integrated Radar Inspection System (IRIS), a GPR system that was developed by Penetradar Corporation for high speed inspection of bridge decks and pavements.
GPR inspections can be utilized on concrete or asphalt pavement, or composite pavements consisting of asphalt and concrete. Radar testing is non-destructive, causing no alteration or damage to the material it examines, and it is not limited significantly by seasonal restrictions, extremes or changes in temperature. In addition, radar inspections can be performed during the day or at night. GPR surveys of pavements are typically conducted using an array of two or more non-contacting antennas. GPR is typically installed in a vehicle and the inspection conducted at highway speed, thereby eliminating the need for maintenance and protection of traffic.
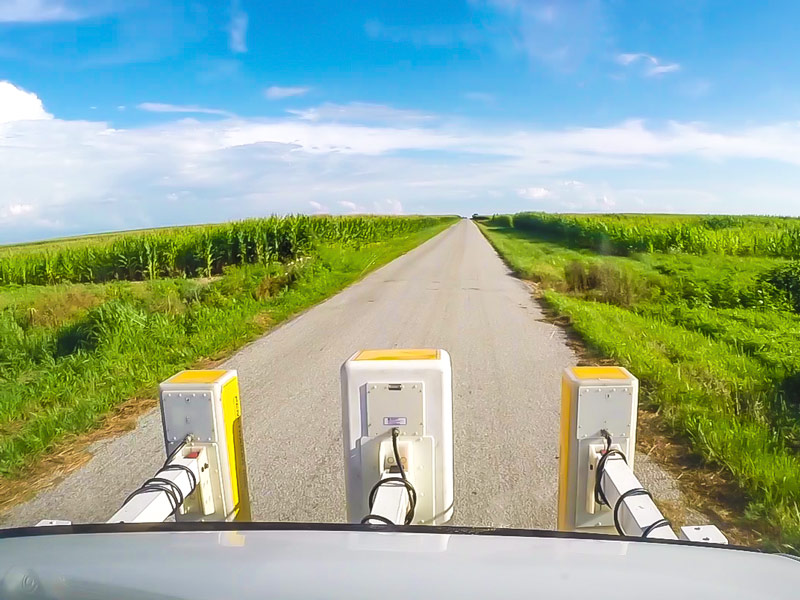
Multi-Frequency Antenna Array System shown scanning pavement.
GPR Pavement Capabilities
Pavement Structure
Pavement Layer Thickness
Voids Beneath Pavements
Detection of Subsurface Moisture
Concrete Deterioration
GPR Data Collection
Radar inspection of pavement including one continuous radar vehicle inspection pass made during the survey for each traffic lane. Three or four non-contacting GPR antennas with varying pulse width are typically installed on the vehicle during the inspection depending upon the resolution required and to provide a greater range of penetration depth and lane coverage.
GPR Data Analysis & Results
Layer Thickness Measurement
Analysis is performed on the data from each radar to determine total thickness of asphalt layer and base layer (where possible), on a continuous basis and reported at 1 foot intervals. Alternate thickness reporting intervals can also be provided. The output is presented in an ASCII file format (that can be exported to a Pavement Management Database - PMS) and/or plan view color topographical format.
Subsurface Moisture Detection
Analysis of GPR data is performed to determine areas of high moisture accumulation in the pavement subbase region. Relative moisture measurements are typically reported on at 1 foot intervals in an ASCII file format which can then be imported to a PMS Database. Relative moisture measurements can also be depicted in a plan-view moisture map of the pavement surface.
Subsurface Void Detection
GPR can indicate locations of subsurface air-filled and water-filled voids. Voids as small as 1/8 inch under rigid pavements are typically detected and reported. The survey is typically conducted using the two or more GPR units inspecting the wheel tracks as a minimum. Void locations are reported in an ASCII file, listing location, or with multiple GPR scans, a plan view mapping of void locations can also be produced which provides spatial locations of voids, as well as individual and total void area.
Concrete Pavement Deterioration Detection
GPR can detect concrete pavement deterioration on exposed concrete pavements or those with an asphalt riding surface. Although, this technique is typically utilized for asphalt overlaid concrete pavements where visual examination is not possible. The survey is typically conducted using three or more non-contacting GPR antennas inspecting the wheel tracks and center lane. Deteriorated regions are reported in an ASCII file listing distance and location. With multiple GPR antenna scans, plan-view mappings of deterioration locations can also be provided showing spatial locations and the total area of deteriorated concrete.
Anomaly Location
GPR is an effective means of detecting and identifying subsurface anomalies such as full depth pavement patches, man-hole covers overlaid with asphalt, buried utilities and utility cuts, and abandoned rail and trolley tracks. The survey is typically conducted with an array of antennas of varying frequency and depth range. Anomalies are reported in an ASCII file listing distance, location, depth and description of the anomaly.

Example output map showing pavement layer thickness overlaid on provided plans.
Infrared Thermography (IRT)
High Speed Pavement Surveys
Penetradar Technical Services Group also provides infrared thermographic inspection of pavements with a vehicle based system that utilizes an advanced, high resolution thermographic camera and incorporates leading-edge computer based video data acquisition and image processing hardware and software, which results in improved detection rates and accuracy in the location and size of deteriorated concrete areas.
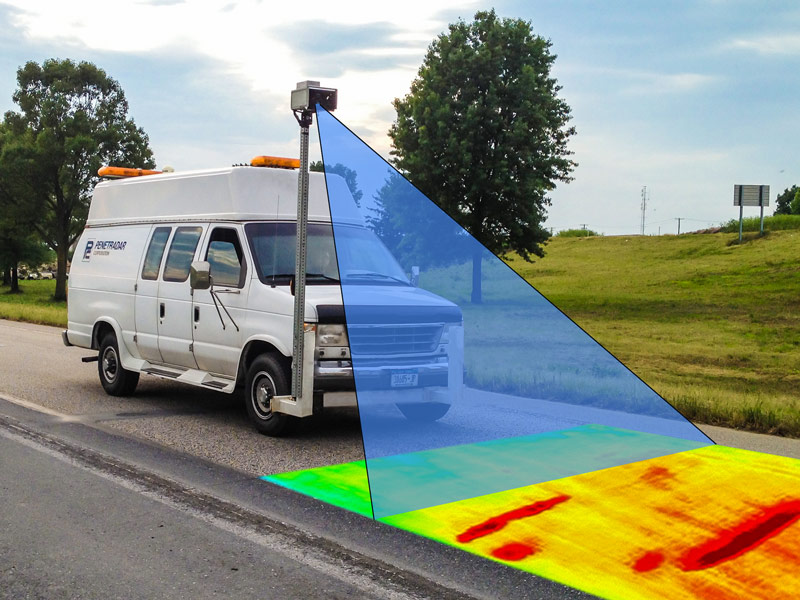
Penetradar's ThermaMap System shown scanning a lane of pavement for concrete deterioration which can be detected by a thermal difference in the concrete.
IRT Pavement Capabilities
Detect Delaminations
Detect Deteriorated Concrete
Detect Debonded Overlays
(other pavement capabilities) - monitoring temperatures of HMA paving operations
IRT Data Collection
Infrared Thermographic data are collected, utilizing a high resolution, forward looking, infrared thermographic camera. The camera's wide angle lens allows for full lane infrared capture on pavement, so only one pass is needed per lane. Also the infrared camera records radiometric data, meaning temperature values are embedded into the data. This is important for post-processing by producing optimal temperature ranges for detailed data analysis.
Due to the nature of the heating/cooling cycles in the bridge deck, for delamination detection, the optimal times for infrared data collection are during the morning/early afternoon hours (10:00AM - 12:30PM) or during the evening/night hours for a 3-4 hour window after sunset.
IRT Data Analysis
Infrared Thermographic data are analyzed using specialized software developed for analysis of IRT data. The software is used to detect regions of concrete that exhibited statistically higher temperatures (for daytime collected data) or lower temperatures (for nighttime collected data) relative to the surrounding concrete temperature. These regions of temperature difference usually correspond to locations of deteriorated/delaminated/debonded concrete. Video Imaging is used with Infrared Thermography to help increase the reliability of these locations been labeled as delaminations.
Results - Deliverables
Penetradar’s cutting-edge analysis software produces accurately scaled, plan-view (top-down perspective) thermal maps showing delaminations based upon distance. Our software preserves of the size, dimensions and location of thermal anomalies such as delamination, debonding or other flaws. This process removes much of the subjectivity and errors that are inherent with older, manual analysis methods.

Infrared Thermography can be used for HMA paving monitoring. The thermal difference information between the asphalt be used to determine issues that may arise in the future of the pavement.
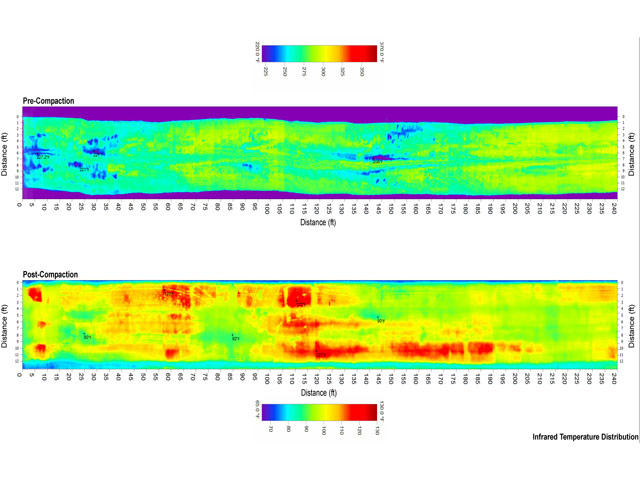
Output map showing the temperature distribution across a lane during and after a HMA paving operation. These temperature are used to find potential "bad spots" inconsistencies in the pavement which could lead to problems in the future.
High Resolution Imaging (HRI)
High Speed Pavement Surveys
A new method, developed by Penetradar Corporation, utilizes a vehicle based video mapping system and specialized software that converts the high resolution video into “plan-view” images. The new software, the function of which is analogous to a line-scan recorder, takes individual portions of each video image to recreate a top-view (or plan-view) image of the roadway. In this way, pavement dimensions, the locations and size of detections are accurately preserved and in addition, this new method reduces time on-site and minimizes the requirement for lane closures..
The use of this wide-angle high-resolution video camera not only can record in detail areas of interest such as patching and spalls, but it is an invaluable assistant to the use of Infrared Thermography and is helpful to Ground Penetradar Radar. The video recording help with assuring that potential detections found by the infrared camera are just that and not something in the road or a surface feature. These seem obvious, but as not as such with just the use of the infrared camera.
This is why it is recommended to use the video camera along with the other technologies for inspection. Even though GPR uses waveforms for detecting areas of interest, a video recording of the pavement can prove to be very useful for referencing. The final processed plan-view visual map of the pavement surface may be used along with the other created maps to create a complete inspection map of the roadway with detections overlaid on top of the pavement's current representation with detailed features preserved.
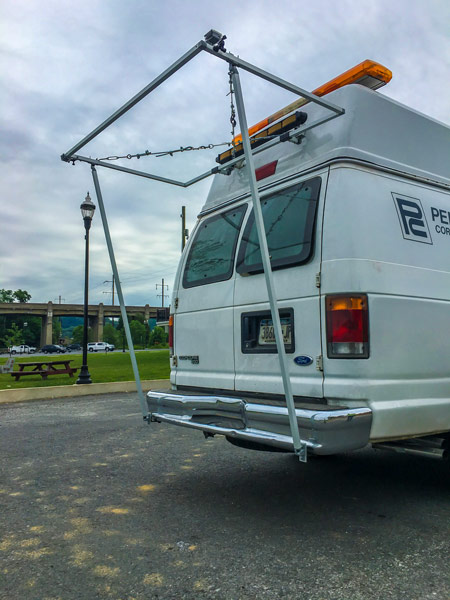
Video recordings are captured at an ultra-high resolution (4K) of up to 3840x2160 at 60 fps.
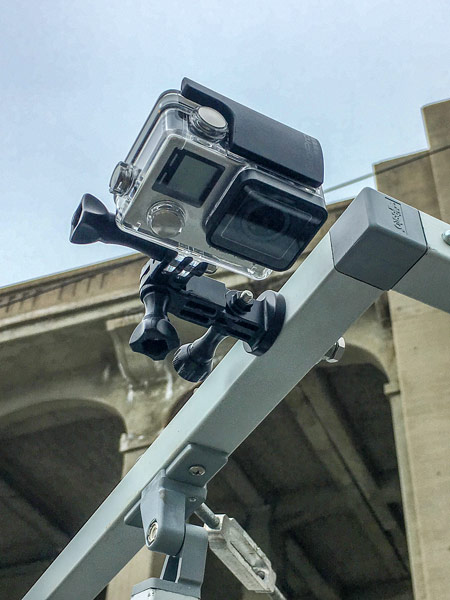
Ensuring that all details of the bridge deck and pavement surfaces are recorded with maximum quality at highway speeds.
HRI Bridge Deck Capabilities
Visual Plan-View Maps of Deck Surface showing detailed surface conditions including cracks, spalls, patches
(assists GPR & IRT in)
Detect Delaminations
Concrete Deterioration
Void Beneath Pavements
Image Capture
Video imaging is collected in the daylight hours to ensure proper lighting in the video, to detect areas of importance in the pavement. The camera is synchronized with the vehicle's distance measuring instrument (DMI) to relate the distance traveled with the video. The high resolution and frame rate of the camera, along with the precise pulse rate (less than one inch per pulse) of the DMI allow of accurate high speed video recording and data collection. Possessing a wide angle lens, the camera can capture multiple lanes from a centralized vehicle pass across the lanes; reducing scanning time.
Image Analysis & Post-Processing
The captured video of pavements is put through Penetradar's software specifically designed for removing the oblique perspective of the video and converting it into a correctly scaled top-down view (plan-view) map. This software takes the frames from the video and basically pulls out the correct number of lines corresponding to the distance embedded in the file from the dmi. The lines from the frames are then compiled together to create a full length top-down map of the pavement preserving the dimensions of all the surface details
Results - Deliverables
The software processed video creates a visual plan-view map of the roadway surface. The high-resolution of the camera allows this map to shown with great detail any areas of importance such as spalls, patches and cracks. This can be easily identified on the map.
This visual plan-view map can be used in a combination with ground penetrating radar and infrared thermographic produced maps as layers to produce a complete interactive map that allows for different layers of detections and maps to be viewed with any combination. This complete map eliminates the need to view separate maps to compare detection types. The addition of the high resolution visual map layer further enhances the output map adding the ability to see the detections from the GPR and IR maps on the actual surface of the roadway. This helps in visualizing there detections/anomalies are located on the pavement (relative to any surface feature such as spalls and patches).

Visual Plan-View map showing patches, marked out locations and other surface features. The zoomed in section shows the detail that the camera picked up by showing the dimensions and contours of the patches.

